Unleash the Power of
Geospatial Intelligence
Geospatial Intelligence
Visualize, analyze, and collaborate on location-based data with our cutting-edge mapping platform designed for businesses of all sizes.
VIDEOS
Discover Maptable
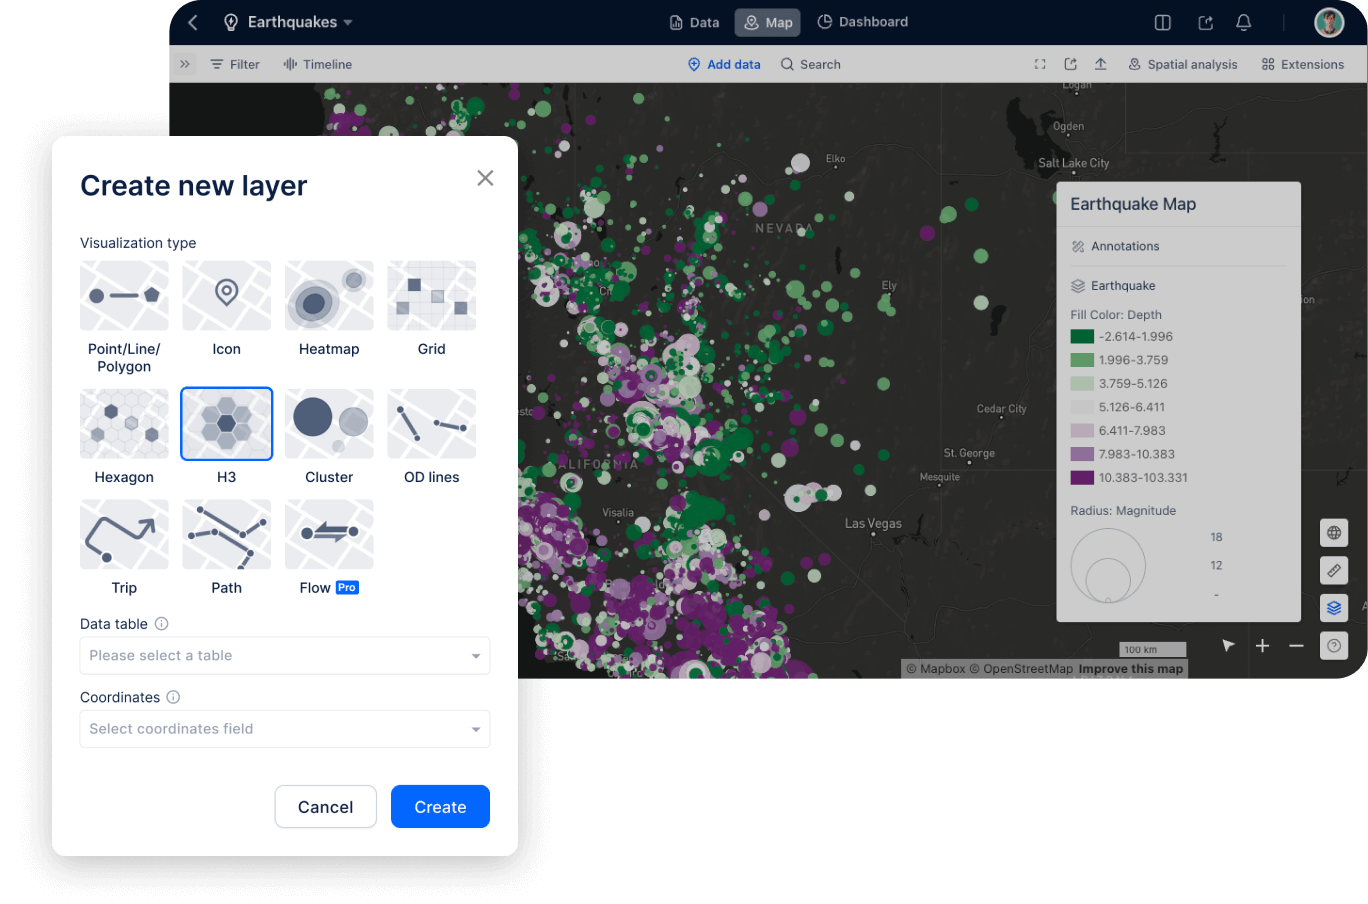
Explore Diverse Visualization Types
Dive into various visualization types to make your data more accessible and insightful
Interactive Dashboard and Seamless Sharing
Create powerful dashboards to visualize metrics and insights
Features
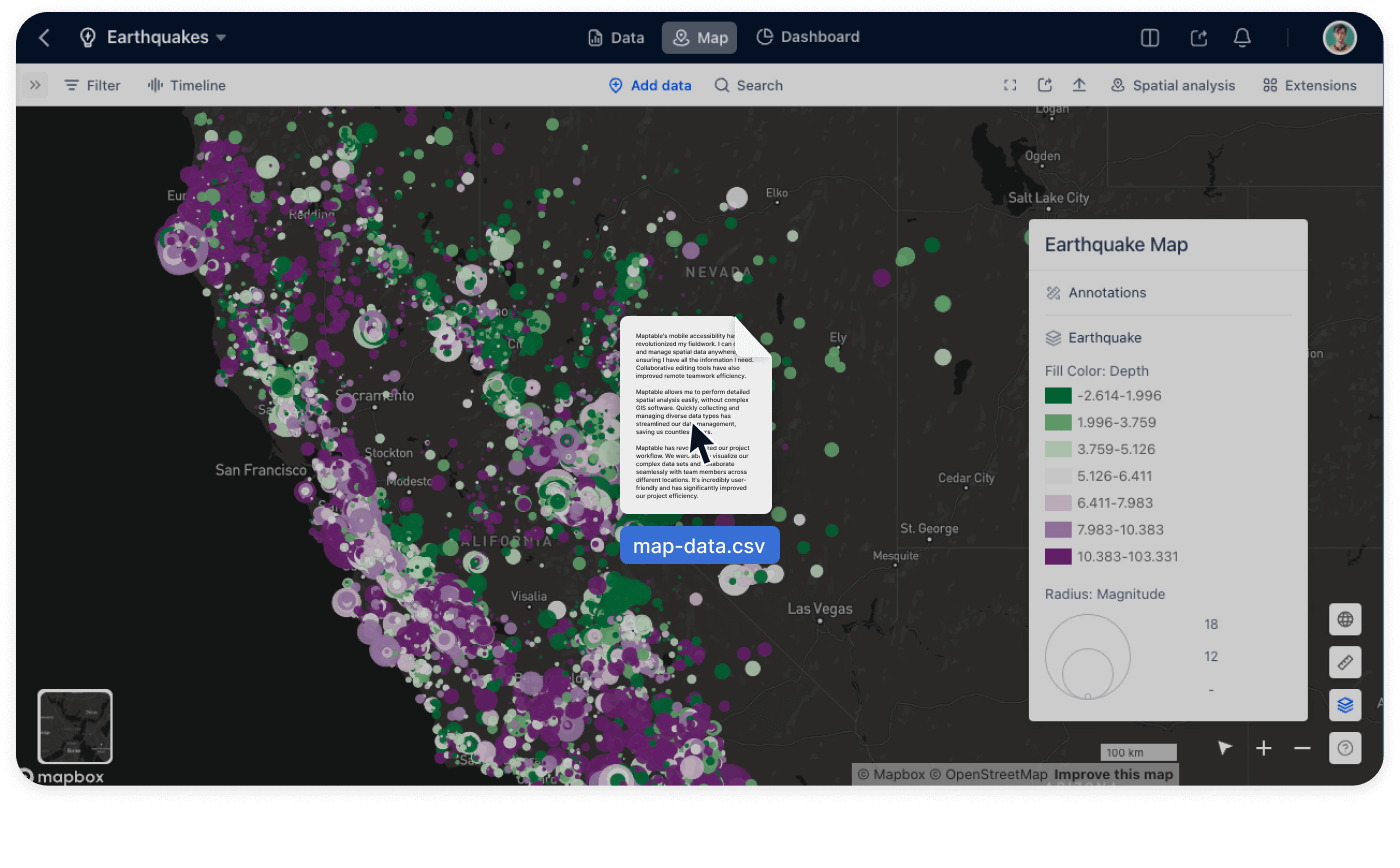
Effortless Visualization and Spatial Analysis
Transform spatial data into dynamic visualizations easily. Perform advanced spatial analysis in-browser, no complex GIS required.
Simple Map Creation
Create interactive maps effortlessly with an intuitive drag-and-drop way.
Customizable Styling
Customize colors and labels to fit your biz needs, making complex data easier to understand and share.
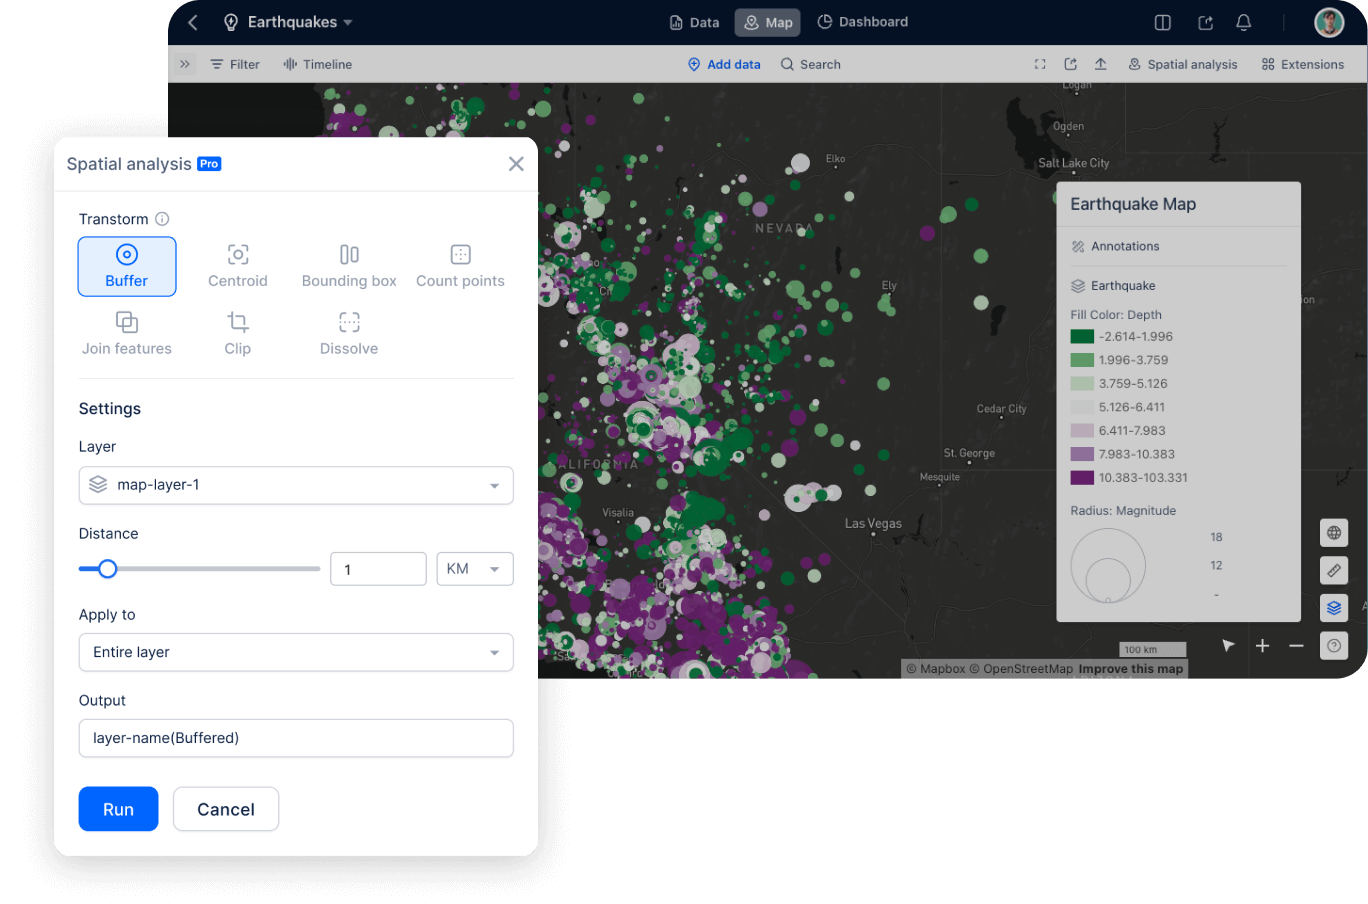
Easy-to-use Spatial Analysis
Unlock deeper insights with our built-in, easy-to-use tools.
Features
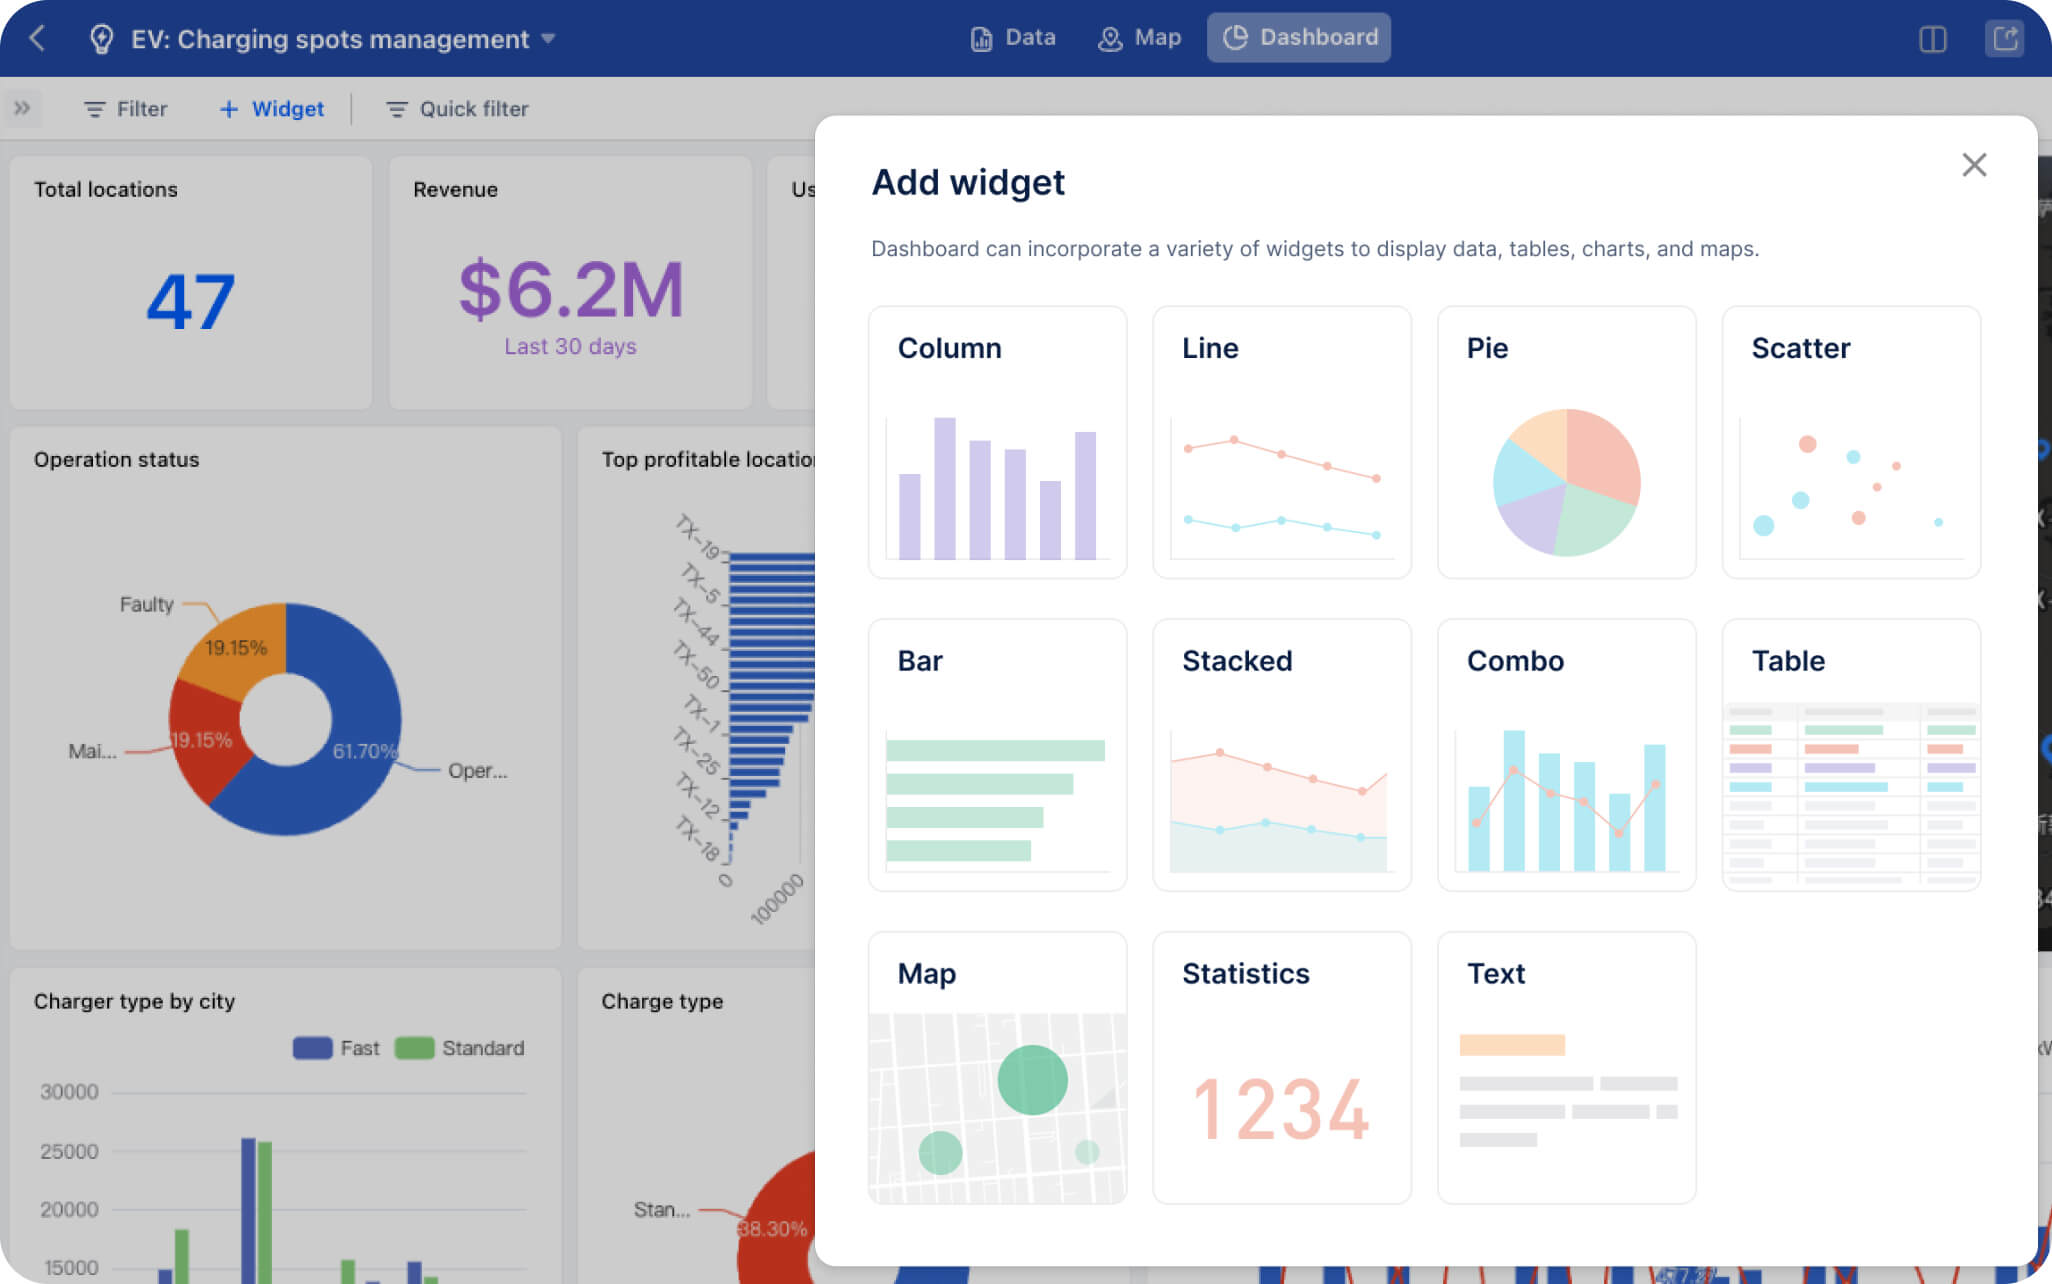
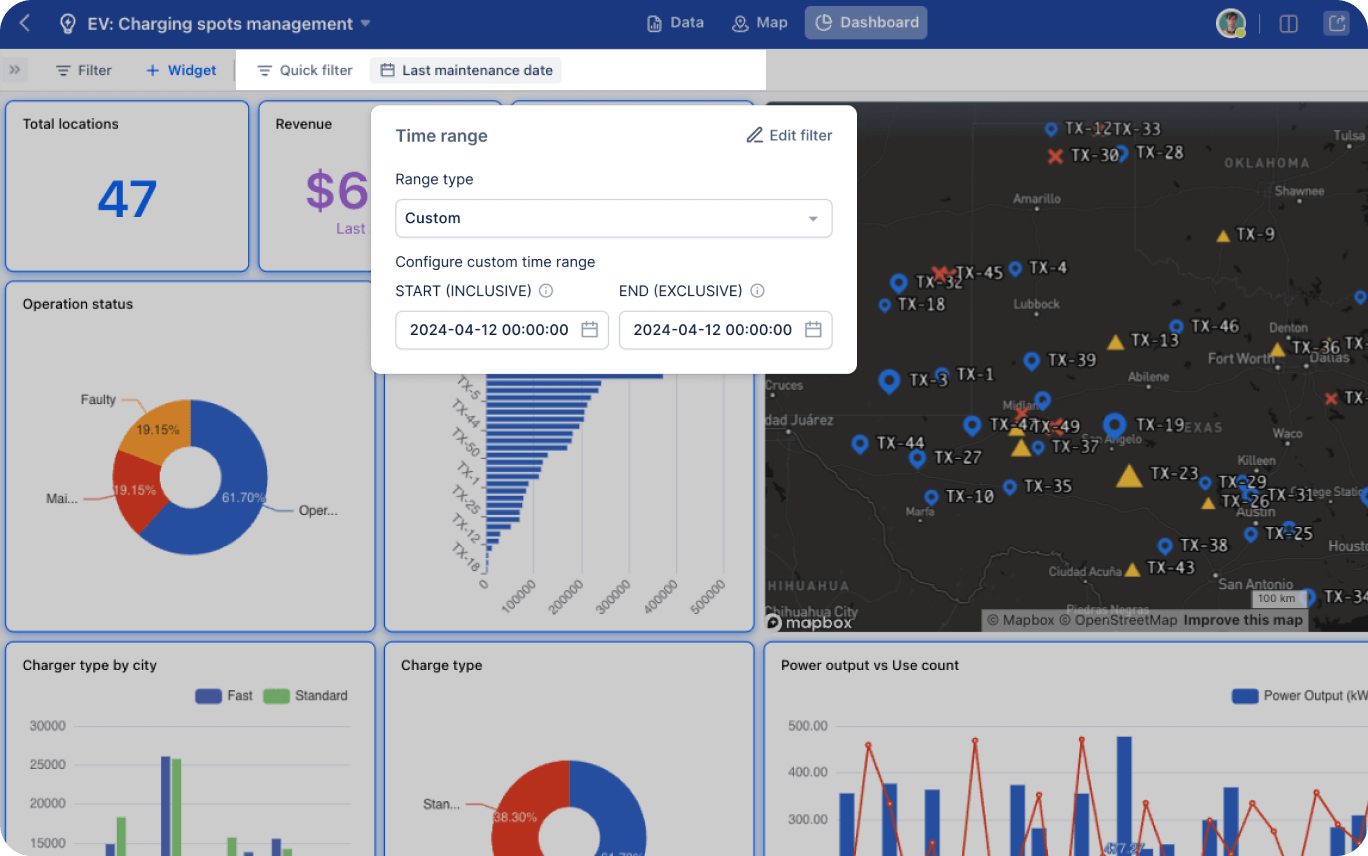
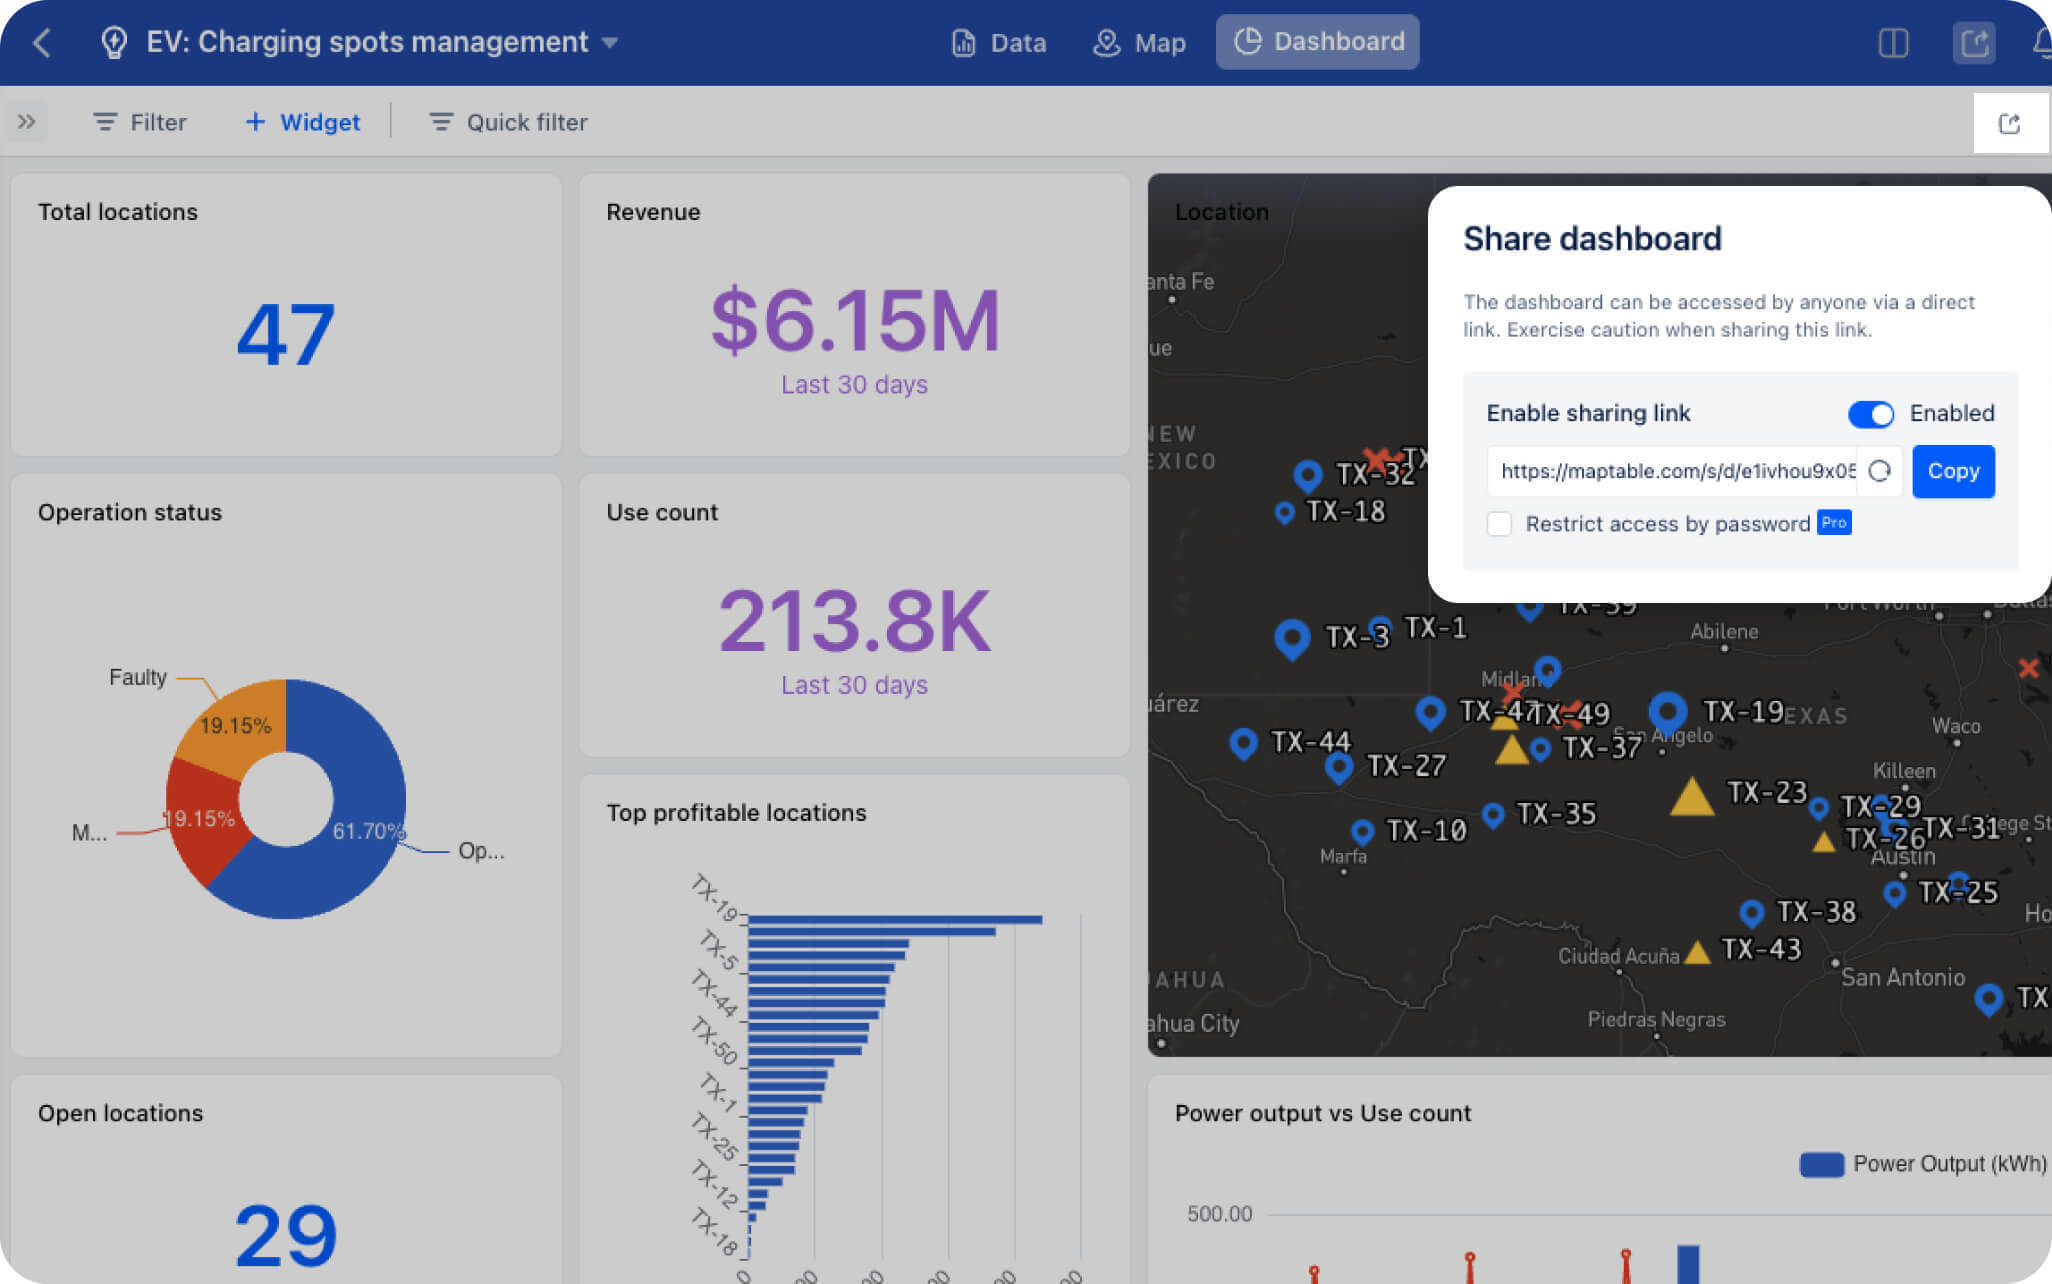
Interactive Dashboard and Seamless Sharing
Create and share interactive dashboards to elevate your data storytelling. Our easy-to-use, customizable widgets make exploring data engaging and insightful.
Rich Widgets Options
Our dashboards feature a range of widgets like bar, line, and pie charts. You can also embed maps, bringing your data to life.
Cross Filtering
Cross filtering lets you refine data in real-time, focusing on key information for more precise analysis.
Effortless Sharing
Easily share dashboards and visualizations with your team and stakeholders, keeping everyone aligned with the latest data and insights.
Features
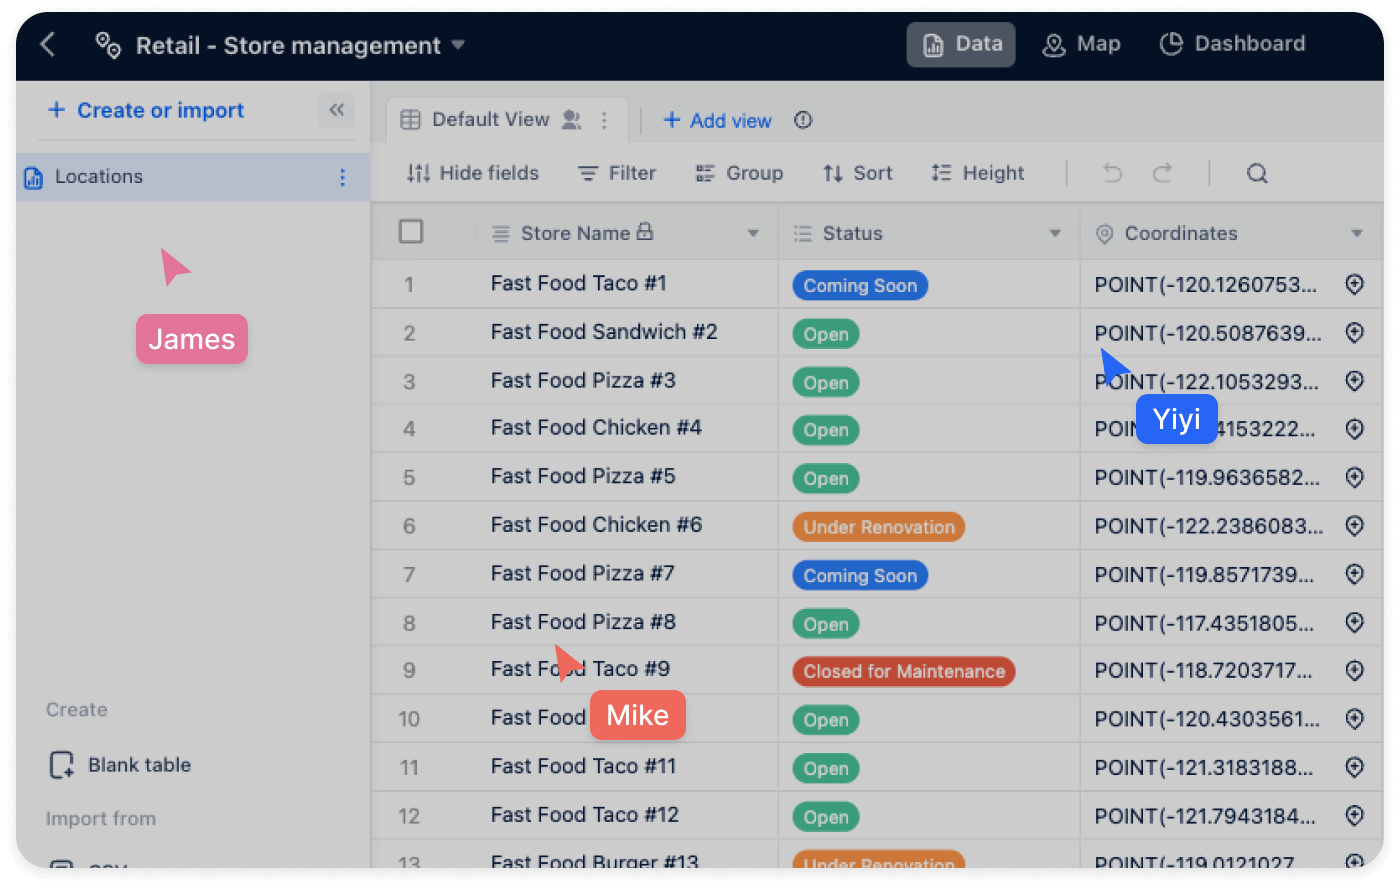
Collaborative Data Management
Boost your team's workflow with real-time editing, and mobile-friendly design. Easily manage diverse spatial data anytime, anywhere.
Collaborative Editing
Boost teamwork by enabling real-time, simultaneous editing and updating of spatial data by multiple users.
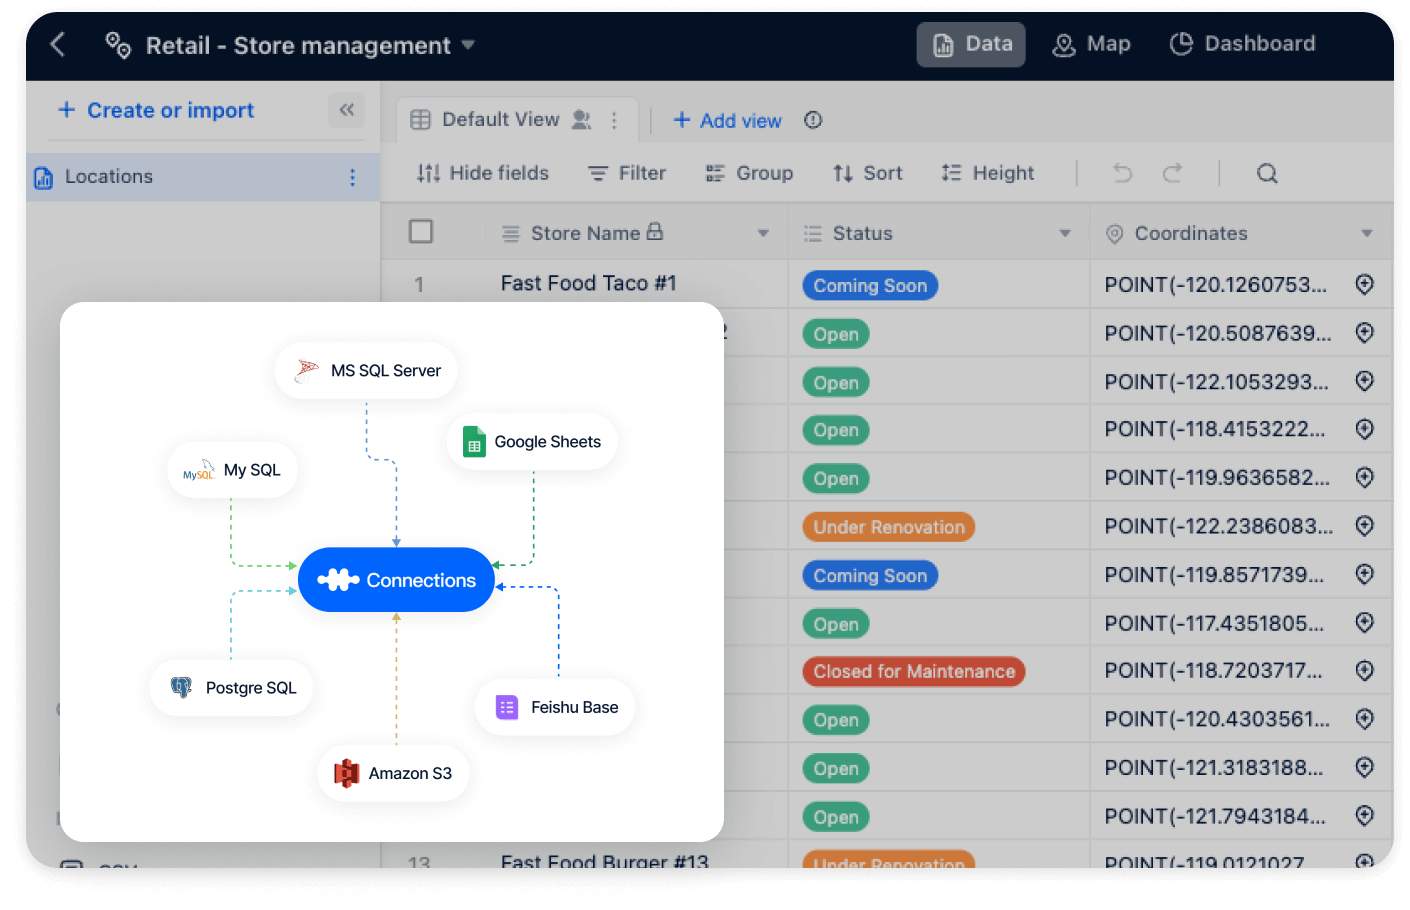
Efficient Data Collection
Seamlessly gather various data types including numbers, text, dates, coordinates, and attachments, making data collection effortless.
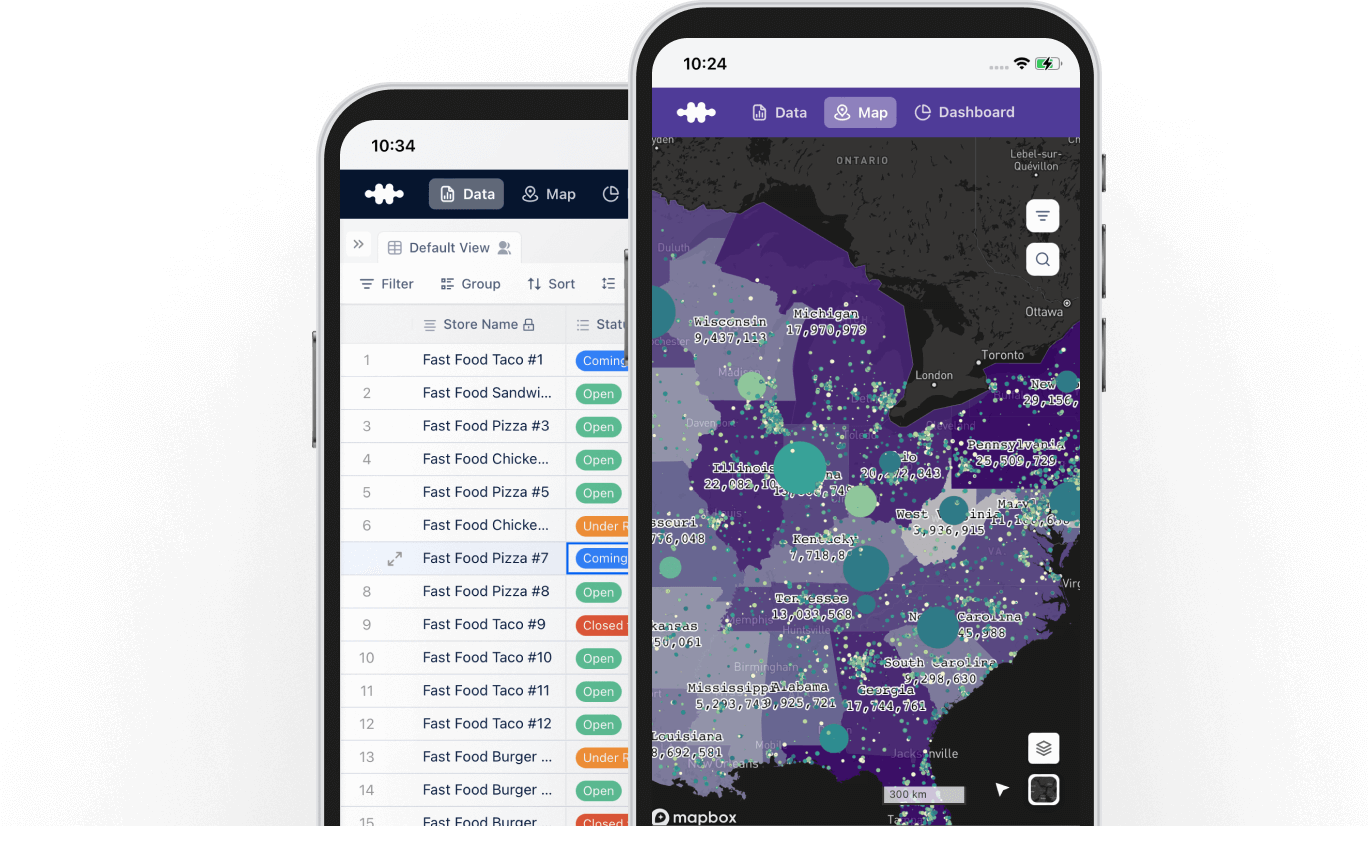
Mobile Accessibility
Manage and access spatial data anytime, anywhere with a responsive design optimized for mobile devices.
Gallery
Supply chain - Inventory management
View facilities distribution and visually track inventory occupancy by region
test1
test1